
qEEG brain mapping is a mathematical analysis of electroencephalogram (EEG) data that converts raw brainwave recordings into power spectra and color-coded topographic maps compared against age-matched norms. Clinicians use it to objectively measure brain electrical activity, support diagnostic impressions for certain neurological conditions, and guide neurofeedback protocols. The essential caveat: qEEG is an adjunctive tool. It informs clinical judgment; it does not replace a thorough evaluation by a trained clinician.
TL;DR:
- qEEG provides normative comparisons of brain activity, but its results depend heavily on matching demographic data to the patient’s profile.
- Elevated theta/beta ratios are associated with ADHD but are not definitive diagnostics and should always be interpreted alongside clinical assessments.
- The quality of a qEEG report relies on proper patient preparation, artifact rejection, and transparent methodology, including the normative database used.
- Different spectral analysis methods, such as wavelets or multitapers, can produce varying results, making cross-verification important to avoid misinterpretation.
- qEEG is primarily useful for treatment planning and monitoring, especially in neurological conditions and neurofeedback, but it is not a standalone diagnostic tool.
Table of Contents
- What Is qEEG Brain Mapping and How Does It Differ From Standard EEG?
- Common qEEG Metrics and What They Actually Mean
- Wavelets, Multitapers, and Pepisode: Why the Analysis Method Changes What You See
- What qEEG Can and Cannot Diagnose: Evidence by Condition
- How a qEEG Report Gets Made: Prep, Artifacts, and Warning Signs
- How The Pursuit Counseling Uses qEEG to Guide Neurofeedback and Treatment
- The Limits of qEEG: What Responsible Providers Won’t Claim
- Considering a qEEG Test? Here’s Your Checklist
- A Clinician’s View: Powerful Data, Not a Verdict
- Ready to Explore qEEG-Informed Neurofeedback in Georgia?
- Key Studies and Reviews to Read Next
- Sources
- FAQ
What Is qEEG Brain Mapping and How Does It Differ From Standard EEG?
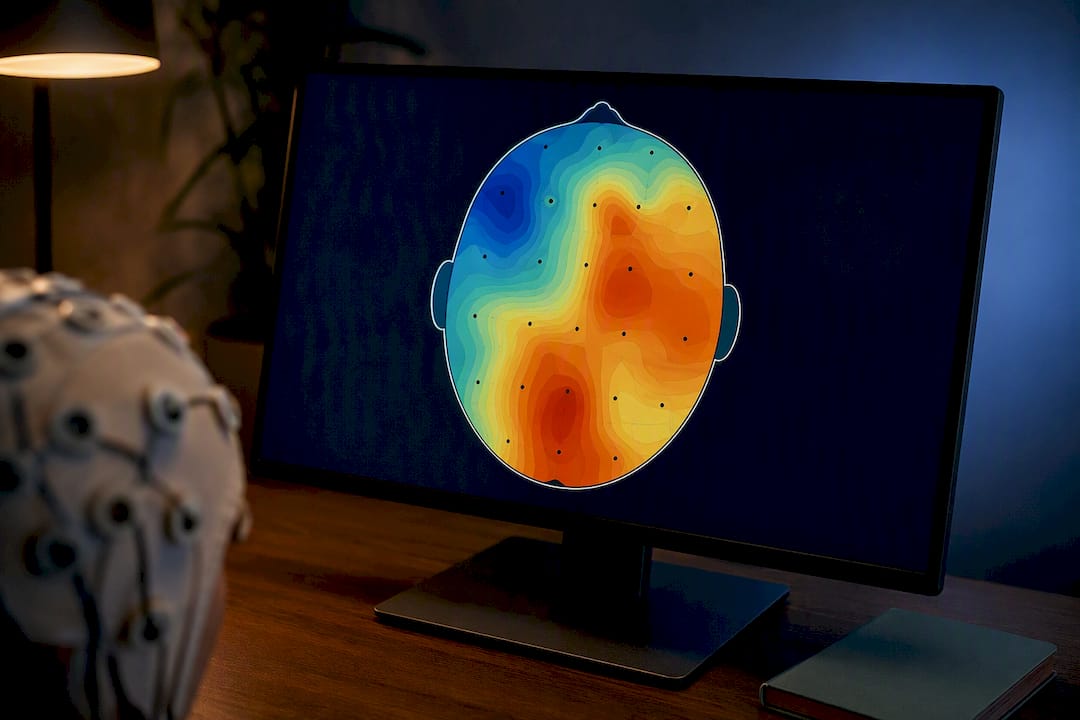
A standard EEG reads squiggly lines across a screen, and a trained neurologist scans those waveforms visually, looking for spikes, slowing, or asymmetries tied to seizures or structural damage. Quantitative EEG takes that same raw signal and puts it through mathematical analysis, most often a Fast Fourier Transform (FFT), to break the waveform into its component frequencies. The output is a power spectrum showing how much energy exists at each frequency, then a topographic map layered onto a head diagram, colored to show where activity runs high or low compared to a reference group.
That comparison step is what separates qEEG from a routine clinical EEG reading. A quantitative EEG computation pulls absolute and relative power values, then plots them against a normative database of healthy individuals matched by age, producing a z-score for every electrode site. A z-score of zero means the patient matches the average. A score of positive two means the value sits two standard deviations above what’s typical for that age group at that site. This scoring approach is why proper database provenance matters enormously. If the normative sample isn’t demographically similar to the patient, the z-scores mean very little.
Here’s the acquisition side clinicians work with:
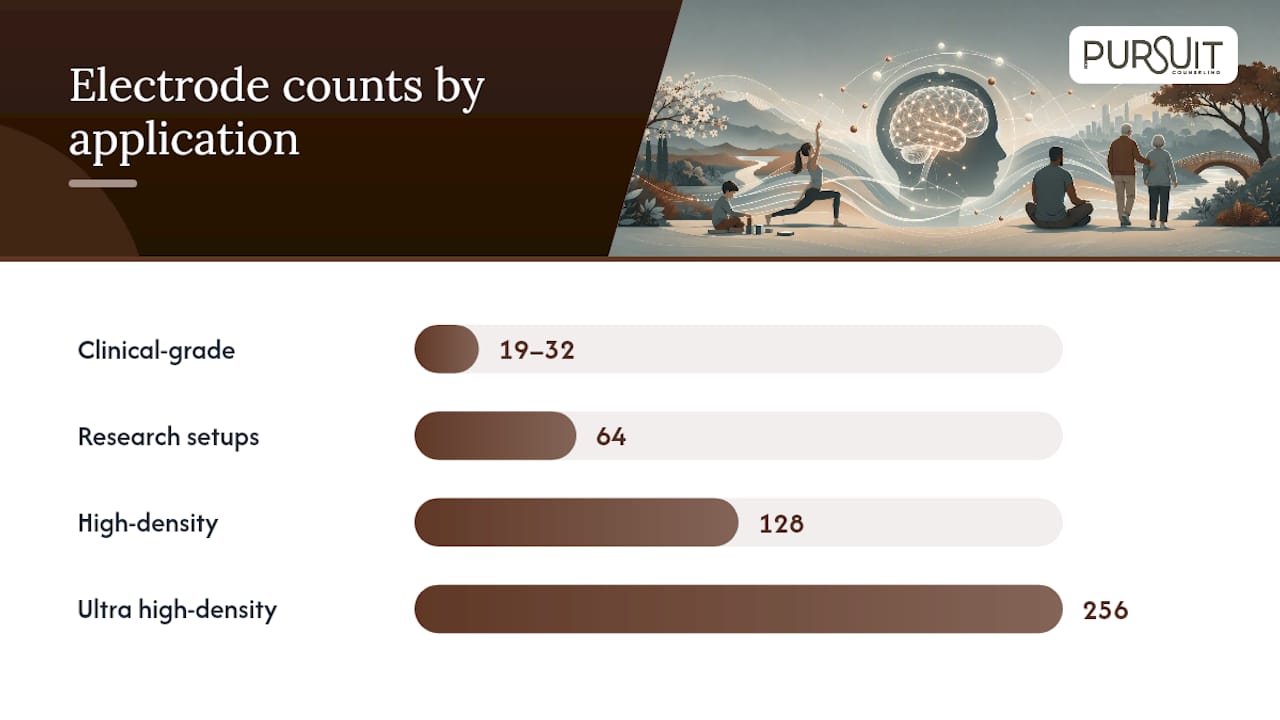
- Electrode arrays: Clinical-grade qEEG typically uses 19 to 32 channels arranged per the International 10-20 System, though research and high-density applications can use 64, 128, or even 256 electrodes for finer spatial resolution.
- Sampling rates: Most clinical recordings sample at 250 to 500 Hz, fast enough to capture activity well into the gamma range without aliasing.
- Recording length: A usable qEEG sample generally needs several minutes of artifact-free data, both eyes-open and eyes-closed, to build a stable spectral estimate.
- Reference montage: Linked-ears or average reference schemes affect absolute values, so reports should specify which montage was used.
The processing pipeline moves through distinct stages: raw signal filtering to remove line noise and drift, artifact rejection to strip out eye blinks and muscle tension, then FFT-based spectral decomposition that produces power spectral density (PSD) values for each frequency band at each electrode. Analysts then calculate ratios, most famously the theta/beta ratio, and connectivity measures like coherence between electrode pairs. Interpolation software fills in the space between electrodes to generate the smooth, colorful topographic map most people associate with qEEG brain mapping. That smoothing is mathematically convenient and clinically useful, but it’s also where misinterpretation creeps in if a clinician treats a smoothed estimate as if it were a precise localization of neural tissue.
Common qEEG Metrics and What They Actually Mean
A finished qEEG report is dense with numbers and colors, and most patients see it for the first time without any context for what a given band or ratio represents. Here’s what clinicians are actually looking at:
- Delta (0.5 to 4 Hz): Dominant during deep sleep; elevated delta while awake can suggest encephalopathy, structural lesions, or, in some cases, developmental issues.
- Theta (4 to 8 Hz): Associated with drowsiness and, in frontal regions, sustained attention lapses; frequently elevated in ADHD-related presentations.
- Alpha (8 to 12 Hz): The relaxed, eyes-closed resting rhythm; asymmetries between left and right frontal alpha have been studied extensively in mood research.
- Beta (12 to 30 Hz): Linked to active concentration, alertness, and in some cases anxiety-related hyperarousal.
- Gamma (30+ Hz): Tied to higher-order processing and binding of sensory information; harder to record cleanly due to muscle artifact contamination.
The theta/beta ratio gets outsized attention because it was the basis for one FDA-cleared assessment aid for ADHD. An elevated ratio, meaning relatively more slow theta activity compared to faster beta activity in frontal regions, has shown up repeatedly in ADHD research, but not every patient with attention difficulties shows this pattern, and not everyone with an elevated ratio has ADHD. It’s a supporting data point, never a standalone verdict.
Frontal alpha asymmetry, meaning a measurable imbalance in alpha power between the left and right frontal lobes, has been explored as a marker in depression and anxiety research for decades. It’s a genuinely interesting finding pattern, but individual variability is high enough that clinicians treat it as one piece of a larger clinical picture rather than a diagnostic checkbox.
Statistic to know: In most normative qEEG frameworks, findings are considered clinically notable when they fall beyond two standard deviations from the normative mean. This threshold is set because a small percentage of a healthy population will naturally fall outside that range purely by chance, which is exactly why a single elevated z-score at one electrode site rarely justifies a diagnosis on its own. Clinicians look for converging patterns across multiple sites and metrics before drawing conclusions.
Coherence and phase-lag measures round out a typical report, capturing how synchronized activity is between different brain regions. Reduced coherence between frontal and temporal regions, for instance, has been discussed in connection with certain memory and processing concerns, though connectivity findings tend to be the most technically demanding to interpret responsibly and the most prone to overreach in less careful reports.
Wavelets, Multitapers, and Pepisode: Why the Analysis Method Changes What You See
Not all qEEG software crunches numbers the same way, and the method chosen genuinely changes what shows up in a report.
- Wavelet transforms analyze a signal at multiple time scales simultaneously, trading some frequency precision for the ability to pinpoint exactly when a brief oscillatory burst occurred. They’re the tool of choice when timing matters more than frequency exactness, like catching a short spindle of activity that comes and goes in under a second.
- Multitaper methods apply several mathematical tapers to the same data segment and average the results, which sharpens frequency resolution and reduces the noisy variance that a single-taper FFT can introduce. They tend to excel when the goal is a stable, precise estimate of sustained background rhythms rather than catching split-second events.
- Pepisode measures something different entirely: the fraction of total recording time during which oscillatory power at a given frequency exceeds a statistical threshold. Instead of asking “how much power is there,” it asks “how much of the time is this rhythm actually present and behaving like a real oscillation rather than background noise.” That makes it especially sensitive to episodic, on-again-off-again oscillatory activity that averaged power measures can wash out entirely.
A comparative analysis of these three approaches found each one carries genuine complementary strengths. Wavelets catch low-amplitude transient signals that other methods miss, multitapers deliver frequency specificity for steady-state rhythms, and Pepisode isolates true oscillatory episodes from noise that merely resembles an oscillation, according to research comparing these spectral methods. Using more than one method on the same dataset can distinguish a brief, meaningful burst of theta from a sustained, background elevation that shows up identically on a simple averaged power spectrum but carries a very different clinical implication.
Pro Tip: If a qEEG report only shows one type of spectral analysis with no mention of method, ask the provider which approach generated it, and whether they cross-checked findings with a second method. A single-method report catching a short-lived event as if it were constant activity, or vice versa, is a common and avoidable source of misread results.
What qEEG Can and Cannot Diagnose: Evidence by Condition
qEEG’s evidence base isn’t uniform across conditions, and pretending otherwise does patients a disservice. Some applications rest on decades of replicated findings; others are still working toward that bar.
Stronger, more established roles include:
- Epilepsy and encephalopathy monitoring, where qEEG trending helps track slowing patterns or seizure burden over time alongside standard EEG.
- Dementia and cognitive decline assessment, where diffuse slowing and reduced connectivity have shown consistent associations with progressive cognitive impairment.
- Cerebrovascular monitoring, particularly in critical care settings tracking real-time changes in brain electrical activity following stroke or injury.
The adjunctive role in ADHD assessment deserves its own mention, since it’s one of the most publicly recognized applications. The NEBA System received FDA clearance as an aid in ADHD assessment based on theta/beta ratio patterns, a genuinely notable regulatory milestone. It’s still explicitly an aid, used alongside a full clinical workup, not a replacement for one.
Emerging and more contested territory includes psychiatric conditions like depression and anxiety, mild traumatic brain injury, and autism spectrum evaluation. Research in these areas shows patterns worth studying, but the field has not reached consensus on qEEG as a standalone diagnostic marker for any of them. A clinical overview of qEEG in neuropsychiatric disorders notes accepted roles in several neurological conditions alongside a clear caution against standalone use for many psychiatric diagnoses. That distinction between “researched and promising” and “diagnostically established” matters, and a responsible provider will draw it clearly for you.
Where qEEG earns its keep most practically is in treatment planning rather than diagnosis. Clinicians use baseline qEEG findings to select neurofeedback targets, choosing which frequency bands and electrode sites to train based on where a patient’s brain deviates from typical patterns. A comprehensive review of qEEG’s clinical applications frames this as part of a broader shift toward objective neurophysiological biomarkers, which support more individualized therapeutic planning. Repeat qEEG sessions during treatment can then track whether those targeted patterns are actually shifting, giving both clinician and patient a measurable way to gauge progress beyond self-reported symptoms alone.
How a qEEG Report Gets Made: Prep, Artifacts, and Warning Signs
The quality of a qEEG report depends heavily on what happens before and during recording, not just the math afterward.
Patient preparation matters more than most people expect. Clinics typically ask patients to wash their hair the night before without conditioner or styling products, since oil and residue interfere with electrode contact. Caffeine, certain medications, and sleep deprivation can all shift baseline brainwave patterns temporarily, so a responsible clinic will ask about all three beforehand and note them in the final report rather than ignoring their potential influence.
- Muscle artifact (EMG) contaminates higher frequencies, especially in frontal and temporal channels, and can masquerade as elevated beta or gamma activity if not filtered out.
- Eye movement artifact (EOG) shows up strongest in frontal electrodes and can distort delta and theta readings if blinks aren’t properly rejected.
- Electrical line noise, typically at 60 Hz in the United States, needs a notch filter or it will contaminate gamma-band readings entirely.
Pro Tip: Ask any provider for the raw preprocessing details, sampling rate, filter settings, and artifact rejection thresholds, along with the normative database’s demographic makeup. A 2026 review on qEEG methodology notes that without this metadata, comparing results across clinics or over time becomes unreliable.
Red flags worth watching for: a report with no stated methodology, one that leans entirely on a single flashy color map without raw waveform review, or one that skips any mention of which normative database was used and how closely it matches the patient’s age and demographic profile. Interpolated color maps can create the visual impression of a focal “hot spot” that doesn’t correspond to an actual localized abnormality, a pattern flagged directly in professional guidance on qEEG visualization.
How The Pursuit Counseling Uses qEEG to Guide Neurofeedback and Treatment
At The Pursuit Counseling, a qEEG finding is a starting point for a conversation, not a verdict handed down in isolation. The typical pathway looks like this: an initial clinical intake gathers history and presenting concerns, a qEEG recording session captures baseline brain activity, a clinician interprets those findings alongside the intake information, and the two together shape an individualized neurofeedback and therapy plan.
This pathway shows up most often for a few specific presentations:
- Clients working through attention and focus difficulties, including formal ADHD evaluation and treatment for both kids and adults balancing school, work, and high-pressure careers.
- Clients managing anxiety and chronic stress, where elevated arousal patterns can inform which frequency training targets make sense for a given individual.
- High-performing adults, executives, and professionals across the Georgia area looking for an objective baseline alongside traditional talk therapy.
Outcomes get tracked through a combination of qEEG follow-up sessions, symptom check-ins, and standard clinical measures, so progress isn’t just a feeling. It’s something the clinician and client can look at together over time.
Neurofeedback and therapy sessions are offered in Fayetteville, GA, with online follow-up options available to provide flexibility around demanding schedules.
Combining a qEEG baseline with a full clinical interview and standard psychometric tools gives a fuller picture than any single piece could offer alone. A brain map shows patterns; a skilled clinician connects those patterns to a person’s actual lived experience, and that combination is where real treatment planning happens.
The Limits of qEEG: What Responsible Providers Won’t Claim
Professional bodies overseeing clinical neurophysiology have been consistent on one point: qEEG requires genuine clinician expertise to interpret responsibly, and the colorful topographic maps that make it visually compelling are also its biggest risk for overinterpretation.
- qEEG is not a standalone psychiatric diagnostic test in the vast majority of cases; it supports a diagnosis already being built from clinical history, symptom presentation, and standardized assessment tools.
- Regulatory clearance for specific qEEG-based analysis tools, like the theta/beta ratio aid for ADHD assessment, applies narrowly to that specific use. It does not translate into blanket approval for diagnosing unrelated conditions.
- Reproducibility matters. A finding that shows up consistently across repeated recordings, ideally using more than one spectral analysis method, carries more weight than a single anomalous reading.
- Topographic color maps represent interpolated estimates, not direct pictures of localized brain damage or dysfunction, according to professional position statements on qEEG visualization.
Choosing a reputable provider comes down to documentation. Ask what normative database they use and whether its demographics match yours, what spectral methods generated the report, what the clinician’s training and credentials are in EEG interpretation specifically, and whether findings were cross-checked against your actual clinical presentation rather than treated as conclusive on their own. A provider willing to walk through all of that transparently is generally a good sign. One who can’t, or won’t, is worth a second opinion.
Considering a qEEG Test? Here’s Your Checklist
Before booking, a little preparation makes the resulting data far more useful.
- The night before: wash your hair without conditioner, get a normal night’s sleep, and skip caffeine that morning if your clinic requests it.
- During recording: expect a cap or individual electrodes applied with conductive gel, several minutes of quiet sitting with eyes open and then closed, and a technician monitoring for movement or muscle tension.
- Ask about the equipment and process: which normative database is used, what preprocessing and artifact rejection steps are standard, and what credentials the interpreting clinician holds.
- Understand your next steps: findings might point toward neurofeedback protocol selection, a referral to neurology for further workup, or in some cases additional imaging if structural concerns arise.
Pro Tip: Request a copy of your full report, not just a summary page. If a clinic hesitates to share raw findings or methodology details, treat that as a reason to seek a second opinion before committing to a treatment plan based on the results.
A Clinician’s View: Powerful Data, Not a Verdict
qEEG genuinely empowers treatment planning when it’s used the way it’s meant to be used: as one input among several, interpreted by someone trained to weigh it against everything else they know about a client. It becomes a problem the moment it’s treated as an oracle instead of a data point.
The clinicians I trust most treat a qEEG finding the way they’d treat a lab result. Useful, informative, worth discussing, and never the whole story. Pairing it with therapy, psychometric testing, and an honest conversation about symptoms is what turns a color map into an actual treatment plan. If you’re weighing whether qEEG makes sense for your situation, talk to a clinician who can walk you through what your specific results would and wouldn’t tell you before you commit to testing.
— Adam Glendye LPC, CPCS
Ready to Explore qEEG-Informed Neurofeedback in Georgia?
Reading about qEEG is one thing. Having a clinician sit down with your actual results and translate them into a plan built around your life is another. The Pursuit Counseling built its neurofeedback and ADHD-focused care around exactly that combination, pairing brain-mapping data with real clinical judgment instead of handing clients a report and calling it a diagnosis.

If attention difficulties, chronic stress, or anxiety have you wondering what’s actually happening under the surface, The Pursuit Counseling’s neurofeedback and EMDR programs and dedicated ADHD program start with a real conversation about your history before any electrode ever touches your scalp. Clients across Fayetteville, Peachtree City, and South Atlanta can book in-person sessions, and ongoing therapy support is available online for those juggling demanding schedules. For readers exploring adjunctive calming approaches alongside clinical care, mindfulness practices for anxiety offer a complementary perspective worth reading. To take the next step, visit the services and specialties page to review your options, or reach out directly to schedule an initial consultation and find out whether a qEEG-informed approach fits your goals.
Key Studies and Reviews to Read Next
For readers who want to go deeper into the primary literature behind qEEG brain mapping:
- Quantitative electroencephalography as a next-generation tool in neurodiagnostics (Frontiers, 2026), a comprehensive review of clinical applications and interpretive frameworks.
- The Role of Quantitative EEG in the Diagnosis of Neuropsychiatric Disorders (PMC), covering accepted and investigational uses across conditions.
- Comparative analysis of wavelets, multitapers, and Pepisode (PMC2839452), the key methods paper behind spectral-analysis trade-offs.
This article is general information, not a substitute for advice from a qualified doctor. Consult a qualified healthcare professional about your own circumstances before acting on anything here.
Sources
- Quantitative electroencephalography as a next-generation tool in neurodiagnostics: significance, clinical applications, and practical interpretative frameworks (Frontiers)
- The Role of Quantitative EEG in the Diagnosis of Neuropsychiatric Disorders – PMC
- Comparative spectral methods paper (wavelets, multitapers, Pepisode) – PMC2839452
FAQ
Is qEEG brain mapping legit?
Yes, as a measurement tool. qEEG uses well-established mathematical methods like FFT and power spectral density to quantify brain electrical activity, and its core computations are reproducible in open-source research software. Its legitimacy as a standalone diagnostic tool is more limited. It works best as an adjunctive measure interpreted by a trained clinician alongside other clinical information.
Is qEEG covered by insurance?
Coverage varies significantly by insurer, diagnosis, and provider, so it’s worth confirming directly with your insurance plan before scheduling. The Pursuit Counseling operates on a private-pay model, and current program details are available on its services page.
What does a qEEG diagnose?
qEEG doesn’t diagnose conditions on its own. It’s used as an adjunctive tool supporting clinical assessment for epilepsy, encephalopathy, dementia, and certain cerebrovascular concerns, and as one supporting data point in ADHD evaluation, but standalone diagnostic use for most psychiatric conditions remains unsupported by current evidence.
Can you see autism on a qEEG?
Not reliably as a diagnostic marker. Autism spectrum evaluation using qEEG remains an area of active research rather than an established clinical application, and no current qEEG pattern is considered diagnostic for autism on its own.